- News and Stories
- Blog post
- Safety Net
Overcoming Barriers: Finding Better Ways to Ask GetCalFresh Applicants About Income
Introduction
Quick, what’s your monthly income before taxes? Unless you are a salaried employee who doesn’t have other income, it’s not an easy question.
When we ask about income on GetCalFresh, we’re facing a challenge county eligibility workers know well. County workers typically spend most of their time trying to get income information right during eligibility interviews with CalFresh applicants who work. If there were a single easy and accurate way to ask about income, county eligibility staff would have found it by now.
As discussed in our previous post, our data and feedback from counties suggested that many of our applicants struggled to provide accurate income information. We tried consulting the literature for best practices on how to ask people about income, but only found research focused on survey methods (for example here, here, and here), not how to ask about income for the purpose of applying to benefits programs. This led GetCalFresh to conduct our own evaluation of possible ways to ask about income. Because we did not have any kind of reference point (e.g., tax returns) for comparison, evaluating whether one way of collecting income information was better than another way was tricky. Here’s how we did it.
Guiding ideas
The limited research that does exist on the accuracy of income-reporting suggests that under-reporting is a common problem in certain contexts, particularly when individuals have multiple sources of income. Some researchers argue that the causes of under-reporting can be framed in cognitive terms. For example, how do people interpret income questions? What associations do they make? How motivated are they to recall pertinent information? One example of the importance of cognitive processes is the recent finding that in households in which men earn much less than women, both partners tend to overestimate the man’s earnings and underestimate the woman’s earnings.
Viewing the problem in cognitive terms fit well with Code For America’s practices for user-centered research and design, so we started there. We reviewed how we asked about income, with special attention for opportunities to:
- Reduce cognitive complexity: ask for specific information in everyday terms. Don’t ask people to calculate what a computer can calculate for them. Frame questions so that applicants don’t have to separate income from more than 30 days ago vs. nearly 30 days ago.
- Promote recall: people find free-recall tasks, such as listing all their sources of income, to be challenging and tiring. Prompting with a context or example reduces mental effort and increases accuracy.
- Increase motivation: people mentally reconstruct their household income by starting with the basics; we need to keep them engaged enough to fill in further details. To do this, we wanted to make it clear that these questions matter and warrant their attention. Moreover, we believe that helping users feel confident about the quality of their application helps them cope with any bumps in the road.
Breaking up sources of income
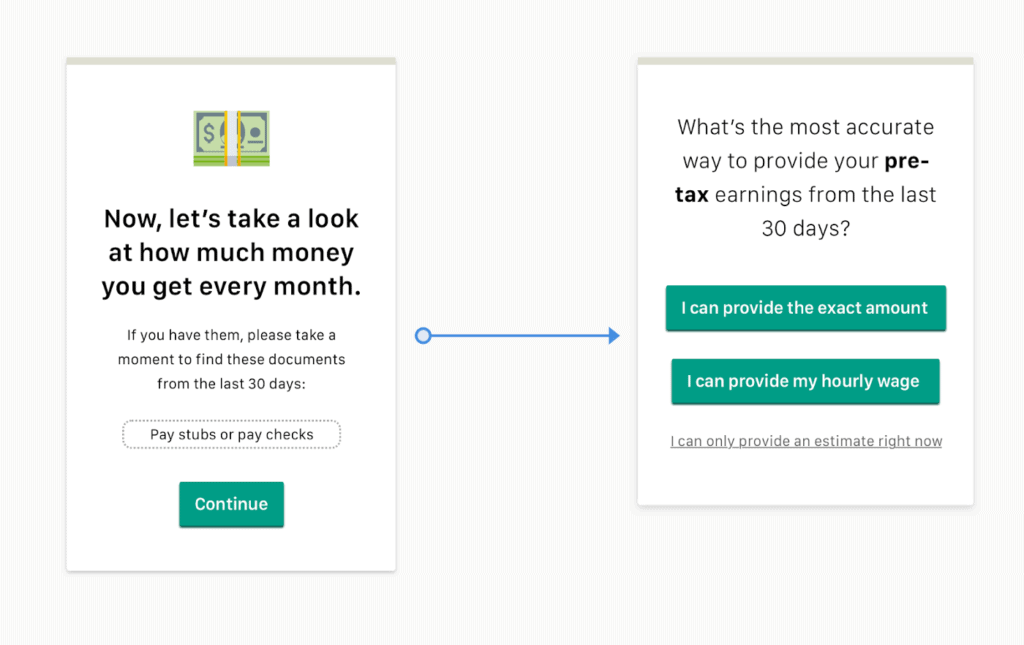
In our last post, we discussed how GetCalFresh discovered that applicants seemed to be under-reporting their incomes and the qualitative research we did to identify potential improvements. The first and most obvious improvement was to split what had been a single income question into separate questions about earned and unearned with common examples. We believed that the original question of total income might have struck some as an invitation to simply supply an estimate. The fact that many applicants were ignoring the warning on our site letting them know that they might be over the gross income limits suggested that applicants did not even believe their own estimates.
Once we split the income question into earned and unearned components, we wanted to see if it seemed to make the data applicants entered more realistic. Again, we didn’t know their true incomes, so we had to rely on properties of the distribution of income data and applicant behavior when they were told that their income might be over the gross limit (i.e., did they believe the data they entered?).
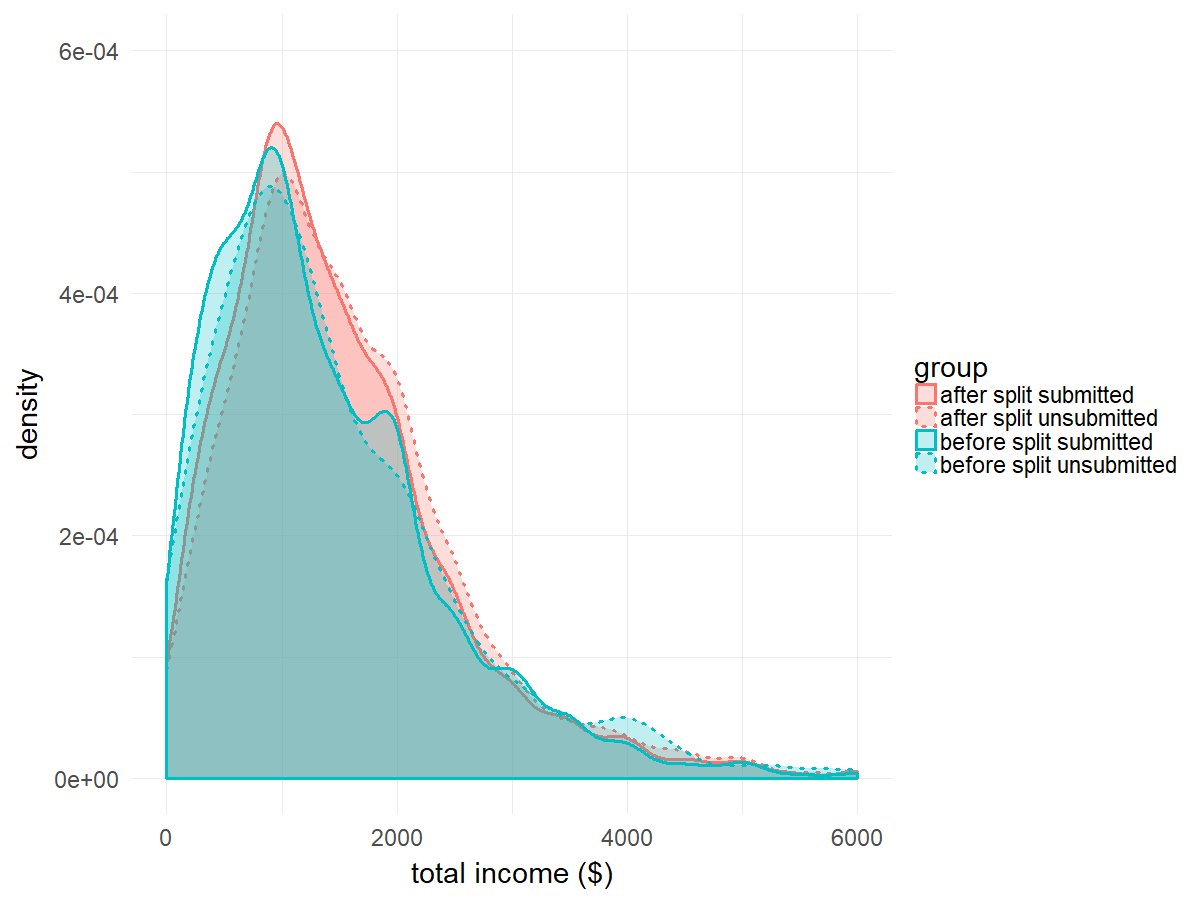
Figure 1 illustrates the results of dividing up earned and unearned income (based on a total of 18,400 applicants). After the change, the submitted mean and median incomes went up about $100 and $150 (respectively). Given the high rate of benefit denials based on verified income (as previously reported, roughly 30% of denials), these increases in reported income are probably a better reflection of reality.
Prior to the split, the distribution of incomes on applications that were submitted and not submitted closely overlapped. After the split, people who went on to submit their application tended to have lower incomes than people who did not submit an application. Comparing the two weeks before and after the change, the percentage of applications with income over the gross limit for their household size fell by 2.2 percentage points. Together, the changes in reported incomes and submissions suggest that breaking income into earned and unearned helped applicants decide whether CalFresh was the right resource for them. For those ineligible, GetCalFresh directs people to immediate food resources at their local food bank or 211.
There was one data inaccuracy introduced by our new process. In this case, we decided that there was little to be gained by the affected users if we required them to do more work to provide better data. We observed several distinct shifts in the lower range of income reporting. The percentage of applicants who reported zero income increased, reflecting applicants clicking “no” to earned and unearned income instead of entering a low number in the box we provided previously. The proportion of applicants who were reporting incomes between $0 and $250 also dropped sharply, while the proportion reporting between $250 and $500 dropped moderately. The proportion reporting between $500 and $1000 dropped more modestly. As these applicants’ actual incomes were in the lowest ranges and more accuracy is unlikely to affect benefit decision outcomes, we decided not to complicate the application process for them.
Helping applicants with diverse job situations calculate earnings
As discussed in our previous post, we did qualitative research into how to ask applicants for earned income information. GetCalFresh learned that people who often assist individuals in applying for CalFresh considered seeing paystubs to be the gold standard, closely followed by hourly wage and hours worked (for those paid on an hourly basis). We wanted to provide applicants with a couple options, depending on how they get paid, and tested mock-ups for each option with potential applicants.
Since earned income is a critical part of our application, GetCalFresh ran an experiment to measure the effects of asking for earned income in these new ways. We randomly assigned three-quarters of applicants who told us they had earned income to the variant condition, in which they could choose between one of three methods for entering their income. The page design encouraged them to choose entering paystub information or their hourly wage and hours worked. As a last resort, they could choose to enter their earned income as a lump amount with a frequency. The control group would continue to enter job income as before (a single lump amount).
Because we did not have access to reference data about incomes, we had to make assumptions about what income distributions ought to look like in order to define success in our experiment. We came up with a few success measures, each imperfect, but that together would give us confidence that income data were more accurate than they had been in the past:
- A reduction in multiples of 100: We knew that the distribution of incomes submitted was too “lumpy;” in other words, they often ended with two or three zeros, such as 500, 1000, 1500, and 2000. People who had expert help in completing their application, such as applicants from the SF-Marin Food Bank, were much less likely to submit an income divisible by 100 (73% among applicants applying without help vs. 41.5% among those who got help from ten of the largest Community Benefit Organizations). An improvement on this measure would be very easy to expect with exact paystub amounts or an hourly wage.
- A reduction in the standard deviation of earned income: If people are making a quick guess, numbers will be wilder than if they take the time to enter their wage and hours worked or look up a paystub (i.e., they are adding error to their estimates). Among households with job earnings and only one or two members, the standard deviation among applicants assisted by ten of our largest CBOs was $190 lower than that of applicants who didn’t have help with their applications.
- An increase in the percentage of people who are warned that they might be ineligible in terms of gross income: As discussed earlier, we knew that many applicants were frustrated to find out only in their interview that they were well over the income limits for CalFresh, and these applications also diverted county staff time.
In addition to these metrics, we were looking for confirmation that none our alternatives were so demanding that applicants were dissuaded from reporting income.
Although the page design slightly favored entering income based on paystub amounts, the improvements we saw in terms of experimental measures were highest among people who entered an hourly wage and hours worked (Table 1; though that does not guarantee that all of these are more accurate). The hourly option showed the greatest improvements in terms of reducing the standard deviation of job income (by $175) and in terms of lowering percentage of job incomes that are a multiple of 100 (from 58.3% to 1.9%). Some of the difference between the paystub and hourly methods in terms of lowering the multiples of 100 is probably attributable to people who select “paystub,” but then choose to enter an approximate number (from memory or rounding the amount on their paystub). We were surprised to see that simply providing the option for a pay amount with a frequency reduced the occurrence of job incomes that were a multiple of 100 in the estimated condition (from 58.3% to 44.2%).
Among those applying for CalFresh, there are likely overall income differences in people who are salaried vs. hourly, so we chose not to compare the median and mean income amounts directly.

We were also interested in whether the variant income methods improved applicant’s ability to assess their chance of being eligible (Table 2). It appears that all three variant options represent improvements relative to the control, but entering an hourly wage again seemed to be the best bet; the hourly wage group was 5.1 percentage points more likely to be told that they were over the gross income limit.
Regardless of experimental condition, applicants with higher incomes in all four groups appeared to be screening themselves out (see mean of unsubmitted and submitted in Table 2). Comparisons between high- and low-income applicant eligibility across entry methods are tricky, particularly with the control and estimated, because incomes that are inadvertently low won’t raise a warning.

Revising based on unexpected results
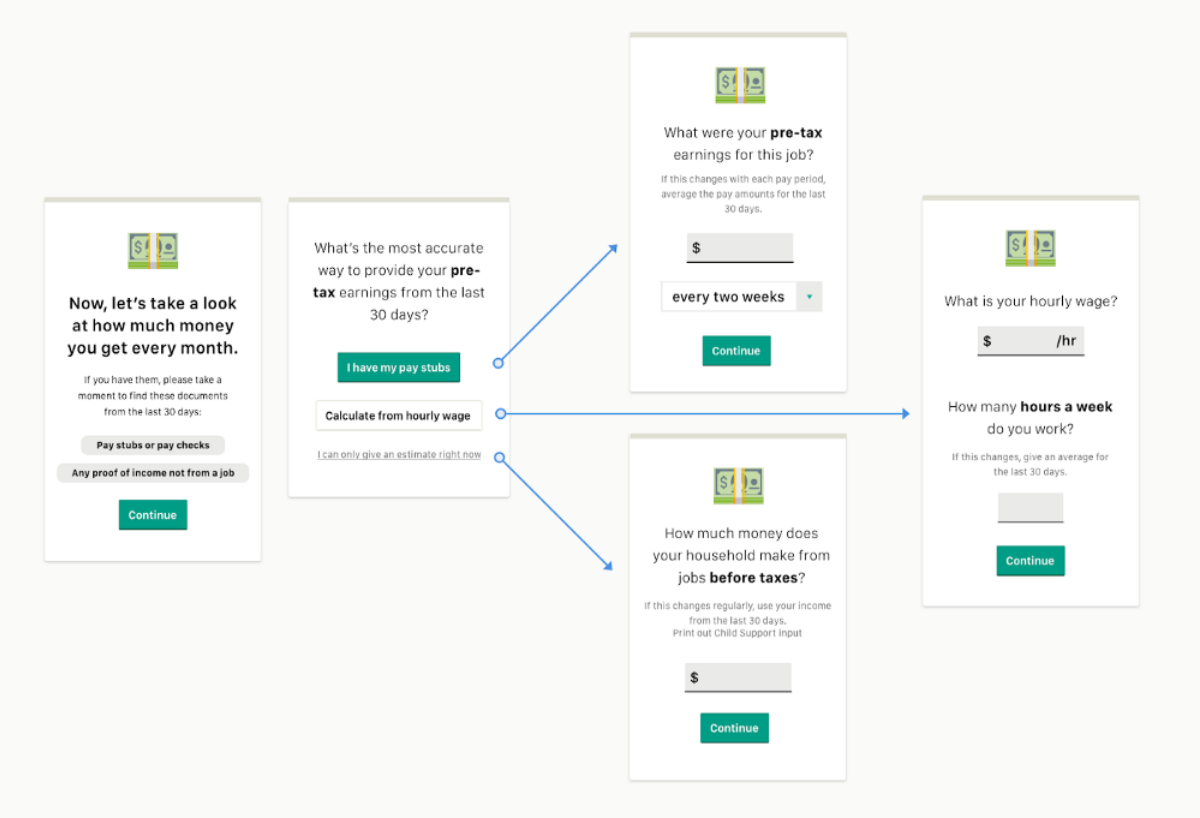
Entering earned income with hourly wage and hours worked or with paystub amounts both appeared to be improvements relative to providing an estimate. To our surprise, the incomes of applicants who chose the hourly option seemed at least as accurate as the incomes from applicants who chose the a pay stub option. Because the properties of the hourly wage data seem reliable, we decided to change our design to equally encourage entering a paystub or wage information (Figure 3). For applicants who are paid hourly, entering their wage and average weekly hours is much more convenient than finding and deciphering a paystub.

Figure 4 shows how the distribution of reported incomes for both these groups (“hourly” in pink and “paystub” in yellow) are higher relative to providing an estimate with a frequency (“estimated” in blue). Put another way, entering a paystub amount with a frequency or an hourly wage and hours worked led to applicants to generally report higher incomes as compared with estimating.

(Note: excludes applications reporting more than one job)
Conclusion
A common heuristic for usability is simplicity, which can lead us to solely evaluate usability in terms of how much is presented to users or how much they are asked to do. Yet in many cases, the type of simplicity we’re after is clarity, not brevity.
Previously, GetCalFresh had been trying to do too much in one question — we boiled all income down to a single field. It was brief, but also amorphous and complicated. By splitting income into several questions, each in everyday terms and with examples, we made the application easier to use. A better user experience went hand-in-hand with better data quality.
Asking for income information is by no means a solved problem. We’ve observed that some applicants still struggle with income questions and we’re exploring new options for them. GetCalFresh will continue research into how to collect accurate information and keep you posted here. In the meantime, if you have ideas, questions, or want to chat, email us at hello@getcalfresh.org.
Appendix: additional earned income experiment details
We ran the experiment for two weeks, until we had at least 1,500 individuals per condition. We designed the paystub and hourly conditions to only accommodate a single job, leaving the estimated condition for people in the variant with more than one job. To make the results across the variant conditions more comparable, however, we only focused on the data from applicants who had reported having a single job. Differences in proportions were evaluated using chi-square tests; differences in standard deviation (variance) were evaluated using F-tests. All tests were two-sided.