The Status Quo of Safety Net Assessment
Before COVID-19, the safety net had cut poverty in this country in half. But it is still not reaching all of the people it should—or reaching people as quickly and efficiently as it could. A significant part of the problem is that safety net system assessments have too often been built to fit administrative requirements and to question applicants’ motives. That is, they’ve been built to ask complicated questions for compliance reports, or to implement duplicative processes to fulfill an administrative checklist.
The current system of data collection across safety net programs is inadequate, and fails at measuring people-centered outcomes, using data as a decision-making tool, and uncovering and addressing racial inequity.

Federal assessment metrics don’t capture the experiences of clients.
States collect and report an overwhelming amount of performance data from safety net programs to federal agencies, sometimes as often as on a monthly basis. But how much does this existing data really tell us about how well these programs are serving people? Existing performance data doesn’t paint a clear picture of the overall health of the benefits systems they seek to describe. Of the dozens of metrics and data points that states are required to submit to the federal government, very few assess the client experience of accessing health and human services programs.
We examined the federally-collected SNAP and Medicaid performance metrics by grouping them into three categories:


Federally-required metrics currently do not measure for human-centered outcomes, which are critical indicators of how well the program served people. The current data does a poor job at revealing the human experience of accessing health and human services programs. As a result, most states lack understanding of how accessible their safety net systems truly are to people who need them.
Federal metrics miss a critical opportunity to measure people-centered outcomes.


More meaningful metrics would allow agency leaders to assess the program more meaningfully than the information that’s currently collected. This information helps leaders ask more thoughtful questions about the program, see how well the program is serving different groups of people, examine gaps in service, and identify opportunities to improve.
What gets measured gets done. States construct programs around federal mandates and requirements. As the metrics currently stand, states are incentivized to reduce risk for administrators, rather than optimize performance based on indicators that progress us toward a human-centered safety net.
Feedback loops help states make use of data instead of just collecting it.
Due to extensive modernization of safety net delivery and eligibility systems, states now have the potential to access more data than ever before—data that could reveal who is being reached, how effective the benefit delivery system is, and where there are problems or barriers to access. But too often, it is not actively used to guide programmatic or operational decision making.
Currently, states collect and create static reports of data and send them to federal agencies. These reports, in and of themselves, don’t help states do anything. Once submitted, they are rarely referenced or utilized in program planning to help inform decision making and program changes over time. An immense amount of energy, time, and human resources are spent collecting data, but not on using data for the improvement of program operations and delivery.

Feedback Loop Cycle
DEFINE the outcome you want to improve
COLLECT data to understand the outcome
ANALYZE data to identify needs or gaps
DESIGN and refine potential solutions
IMPLEMENT a change and measure its effectiveness
Data on its own is meaningless—data only becomes meaningful when it’s used to inform smarter decisions. Creating feedback loops is critical; when the data that is collected is not just a paperwork burden but a critical piece of program operations, it can be used for continuous improvement and to inform decision making. This way, real-time data becomes the navigation system for programmatic decision making, rather than just a point-in-time description of the service.

Beginning as a concept in 2010, Oregon established an Office of Continuous Improvement within the state’s Department of Human Services. The role of the Office of Continuous Improvement is to use performance data from DHS programs to support improvements in service delivery , like decreasing client wait times for benefit determination.

In Pennsylvania, analytics tools are embedded into the state’s online benefits application, COMPASS, which give DHS a window into the client experience applying for benefits. Analytics data show DHS staff where there are breakdowns or barriers in COMPASS usage, and help guide decisions about where to make changes to the online application to make the client experience smoother and easier.

During the rollout of Pandemic-EBT in spring 2020, Minnesota call centers were receiving hundreds of calls a day from clients struggling to navigate this brand new benefits program. Minnesota DHS staff used data from call centers to learn more about commonly asked questions and what clients were struggling with, and then used this information to make changes to P-EBT program implementation and troubleshoot the P-EBT experience.
Gaps in data on race and ethnicity prevent policymakers from addressing inequity in service delivery.
Addressing racial inequity in safety net benefits delivery and access requires tracking client and applicant outcomes by racial group. However, state agencies face persistent challenges in collecting complete, accurate, and consistent race, ethnicity, and language data. Without accurate and comprehensive racial demographic data, it is impossible to identify, evaluate, and address disparities in access and outcomes. Put simply: you can’t fix a problem you can’t see.
In 2020, the Centers for Medicare and Medicaid Services flagged “high concern” around missing race and ethnicity data across a large swath of states. Across safety net programs, incomplete and inaccurate race and ethnicity data plagues systems and hinders accurate assessment and evaluation.
There are three main reasons why race, ethnicity, and language data has been so challenging for state agencies to accurately collect:
Inconsistent Reporting
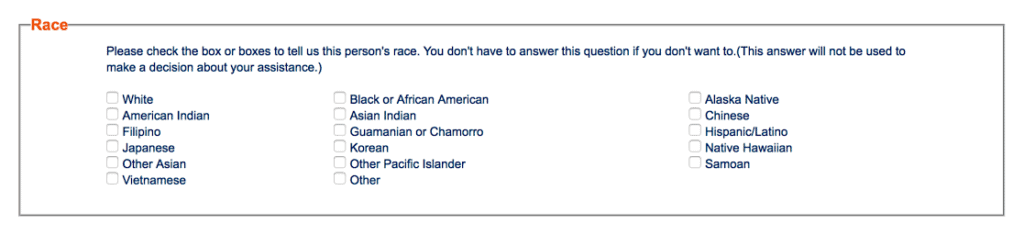
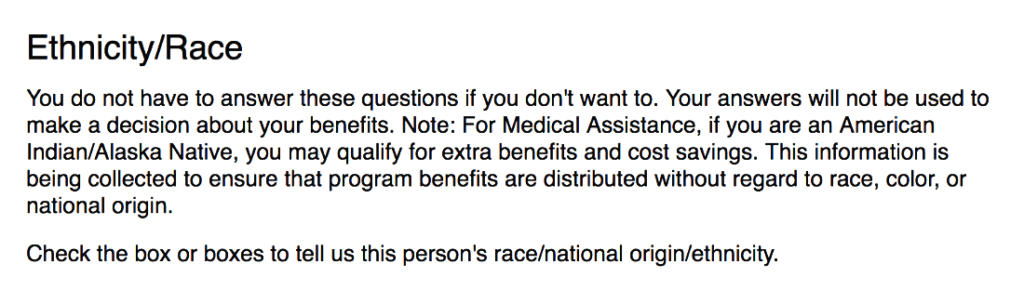
Questions on race are often asked as part of SNAP or Medicaid applications, but these questions are never required because there is no federally mandated reporting standard on race and ethnicity in social safety net programs. A reliance on inconsistent reporting means that applicants don’t have to answer race and ethnicity questions if they don’t want to, which leads to gaping holes in the data. Many states’ benefits applications look like Alaska’s, with a clear statement of the voluntary nature of the race/ethnicity question:
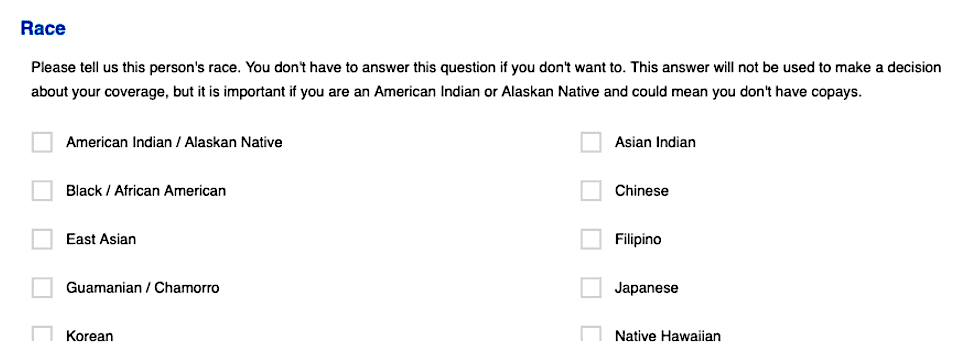
In SNAP cases, states are required to “develop alternative means of collecting the ethnic and racial data on households, such as by observation during the interview, when the information is not provided voluntarily by the household on the application form.” This means that caseworkers are expected to fill in a presumed race or ethnicity for a client even when the client has not self-identified. In these situations, caseworkers are making an assumption about a client’s racial identity based on visual cues or names, which is hugely problematic, and makes the data no more accurate than guesswork. And despite this requirement, race and ethnicity data still is missing for nearly 20% of SNAP participants. On Alabama’s online benefits application, this process is clearly stated as the alternative to a voluntary disclosure:

Getting this policy right requires a careful balancing act in an effort to ensure fair, just, and impartial treatment of all individuals. Reporting one’s race should not be a barrier to receiving a public good, particularly for food and health benefits you’re entitled to. However, the roundabout way states are collecting this data now—through caseworker guesswork or often not at all—is problematic, and we need to experiment with how to encourage more clients to voluntarily report their race and ethnicity.
Inaccurate and Reductive Questions
The way that race and ethnicity questions are asked often doesn’t yield accurate results. This is because the questions are asked inconsistently across states and programs, but it’s also because the current standard of race and ethnicity categories doesn’t match how people self-identify. People aren’t sure what to choose, making their responses inherently inaccurate.
Race and ethnicity questions aren’t asked consistently across states or programs, which means the data that’s collected can’t be compared accurately. There is immense variety in how the question is asked, where it shows up on an application or form, and what race and ethnicity categories are used. There simply is no standard way to ask the question, and though the Office of Management and Budget has established standards for the collection of race and ethnicity data, there is substantial variation in the categories provided. Take a look at the difference between these three states:
In Tennessee, there are at least 10 race categories, and ethnicity is asked separately in a drop-down box:

In Illinois, these questions include 15 race categories and five different ethnicity categories:
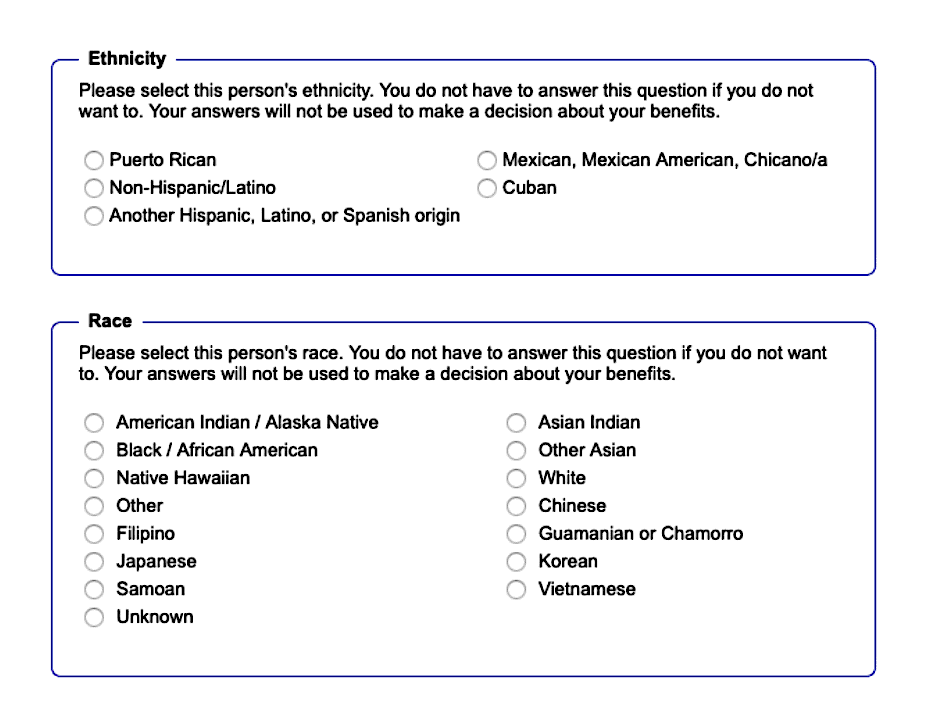
In Louisiana, only 5 race categories are offered:
Another prominent contributor to inaccurate race data is that the categories that are offered often don’t match the way people racially self-identify. In advance of the 2020 census, the Census Bureau conducted research and released a set of recommendations for how to improve the accuracy and reliability of race and ethnicity data. They highlighted the pervasive issue that “Middle Eastern or North African” is almost never listed as a distinct category on race/ethnicity questions (people who identify as Middle Eastern or Arab are currently classified as White), and recommended that this category be added as a universal standard. Additionally, the Bureau found that the distinction between race and ethnicity into two separate questions is confusing, and that combining race and ethnicity (with more detailed checkboxes) led to more responses and improved data accuracy.
Conceptions of race and identity evolve over time, and it’s important that standardized data collection categories evolve with them. When people see themselves represented, government is able to collect more accurate data about them.
Mistrust and Confusion
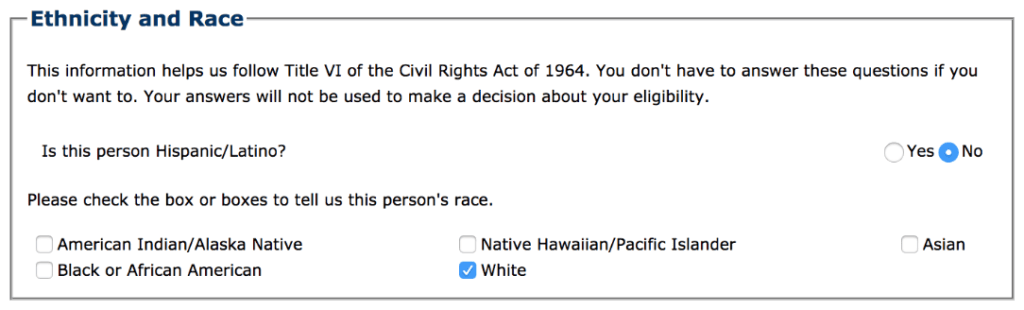
Many people don’t understand why race data is important, or why it’s being asked for, and mistrust how their data will be used. Recent research suggests that simply explaining to people clearly why you’re asking for information about their race makes them more likely to tell you. Recommendations include:
- Explain the importance of collecting race/ethnicity data in the form itself, and explain how the information will be used.
- Provide reminder prompts, like “Are you sure you want to skip this question?”
- Use research-tested messages to explain the value of collecting race and ethnicity data.
Look at this example of how Colorado introduces the race and ethnicity question in their online benefits application:
The collection of accurate and comprehensive race and ethnicity data continues to be an Achilles heel for assessing safety net programs, crippling state agencies’ ability to holistically evaluate program performance with an equity lens. Without accurate data to show how effectively programs are serving people across race and ethnicity, egregious disparities can exist undetected, and agency staff won’t be equipped to understand, evaluate, and address the problem. There is no clean and easy solution to this issue, but more time and energy should be invested in identifying potential solutions to strengthen the collection of accurate data on race and ethnicity.